Làm xong mới xem đáp án
Increase (Tăng)
-
Rose
- English: Increased or went up.
- Vietnamese: Tăng lên.
-
Growth
- English: An upward trend or increase in numbers or size.
- Vietnamese: Sự tăng trưởng.
-
Peaked
- English: Reached the highest point.
- Vietnamese: Đạt đỉnh.
-
Fastest increase
- English: The most rapid growth over a period.
- Vietnamese: Tăng nhanh nhất.
-
Significantly higher
- English: Much greater in value or number.
- Vietnamese: Cao hơn đáng kể.
Decrease (Giảm)
-
Fell
- English: Decreased or went down.
- Vietnamese: Giảm xuống.
-
Dropped
- English: Declined sharply or quickly.
- Vietnamese: Sụt giảm.
-
Declined
- English: Went down steadily or gradually.
- Vietnamese: Suy giảm.
-
Fluctuated downward
- English: Changed frequently with an overall decrease.
- Vietnamese: Dao động theo chiều giảm.
-
Sudden fall
- English: A sharp and unexpected drop.
- Vietnamese: Giảm đột ngột.
Comparison (So sánh)
-
Higher than
- English: Greater in value or number compared to something else.
- Vietnamese: Cao hơn.
-
Lower than
- English: Less in value or number compared to something else.
- Vietnamese: Thấp hơn.
-
Significantly different
- English: A noticeable or marked difference between two values.
- Vietnamese: Khác biệt rõ rệt.
-
Much larger
- English: Substantially greater in size or number.
- Vietnamese: Lớn hơn nhiều.
-
Slightly smaller
- English: A little less in size or number.
- Vietnamese: Nhỏ hơn một chút.
Approximation (Xấp xỉ)
-
Approximately
- English: Around or near a certain number or value.
- Vietnamese: Xấp xỉ.
-
Around
- English: Close to a specific figure or value.
- Vietnamese: Khoảng.
-
Roughly
- English: Not exact but close to a specific number.
- Vietnamese: Ước chừng, xấp xỉ.
-
Just under
- English: Slightly below a particular value.
- Vietnamese: Dưới một chút.
-
Nearly
- English: Almost reaching a specific number or value.
- Vietnamese: Gần
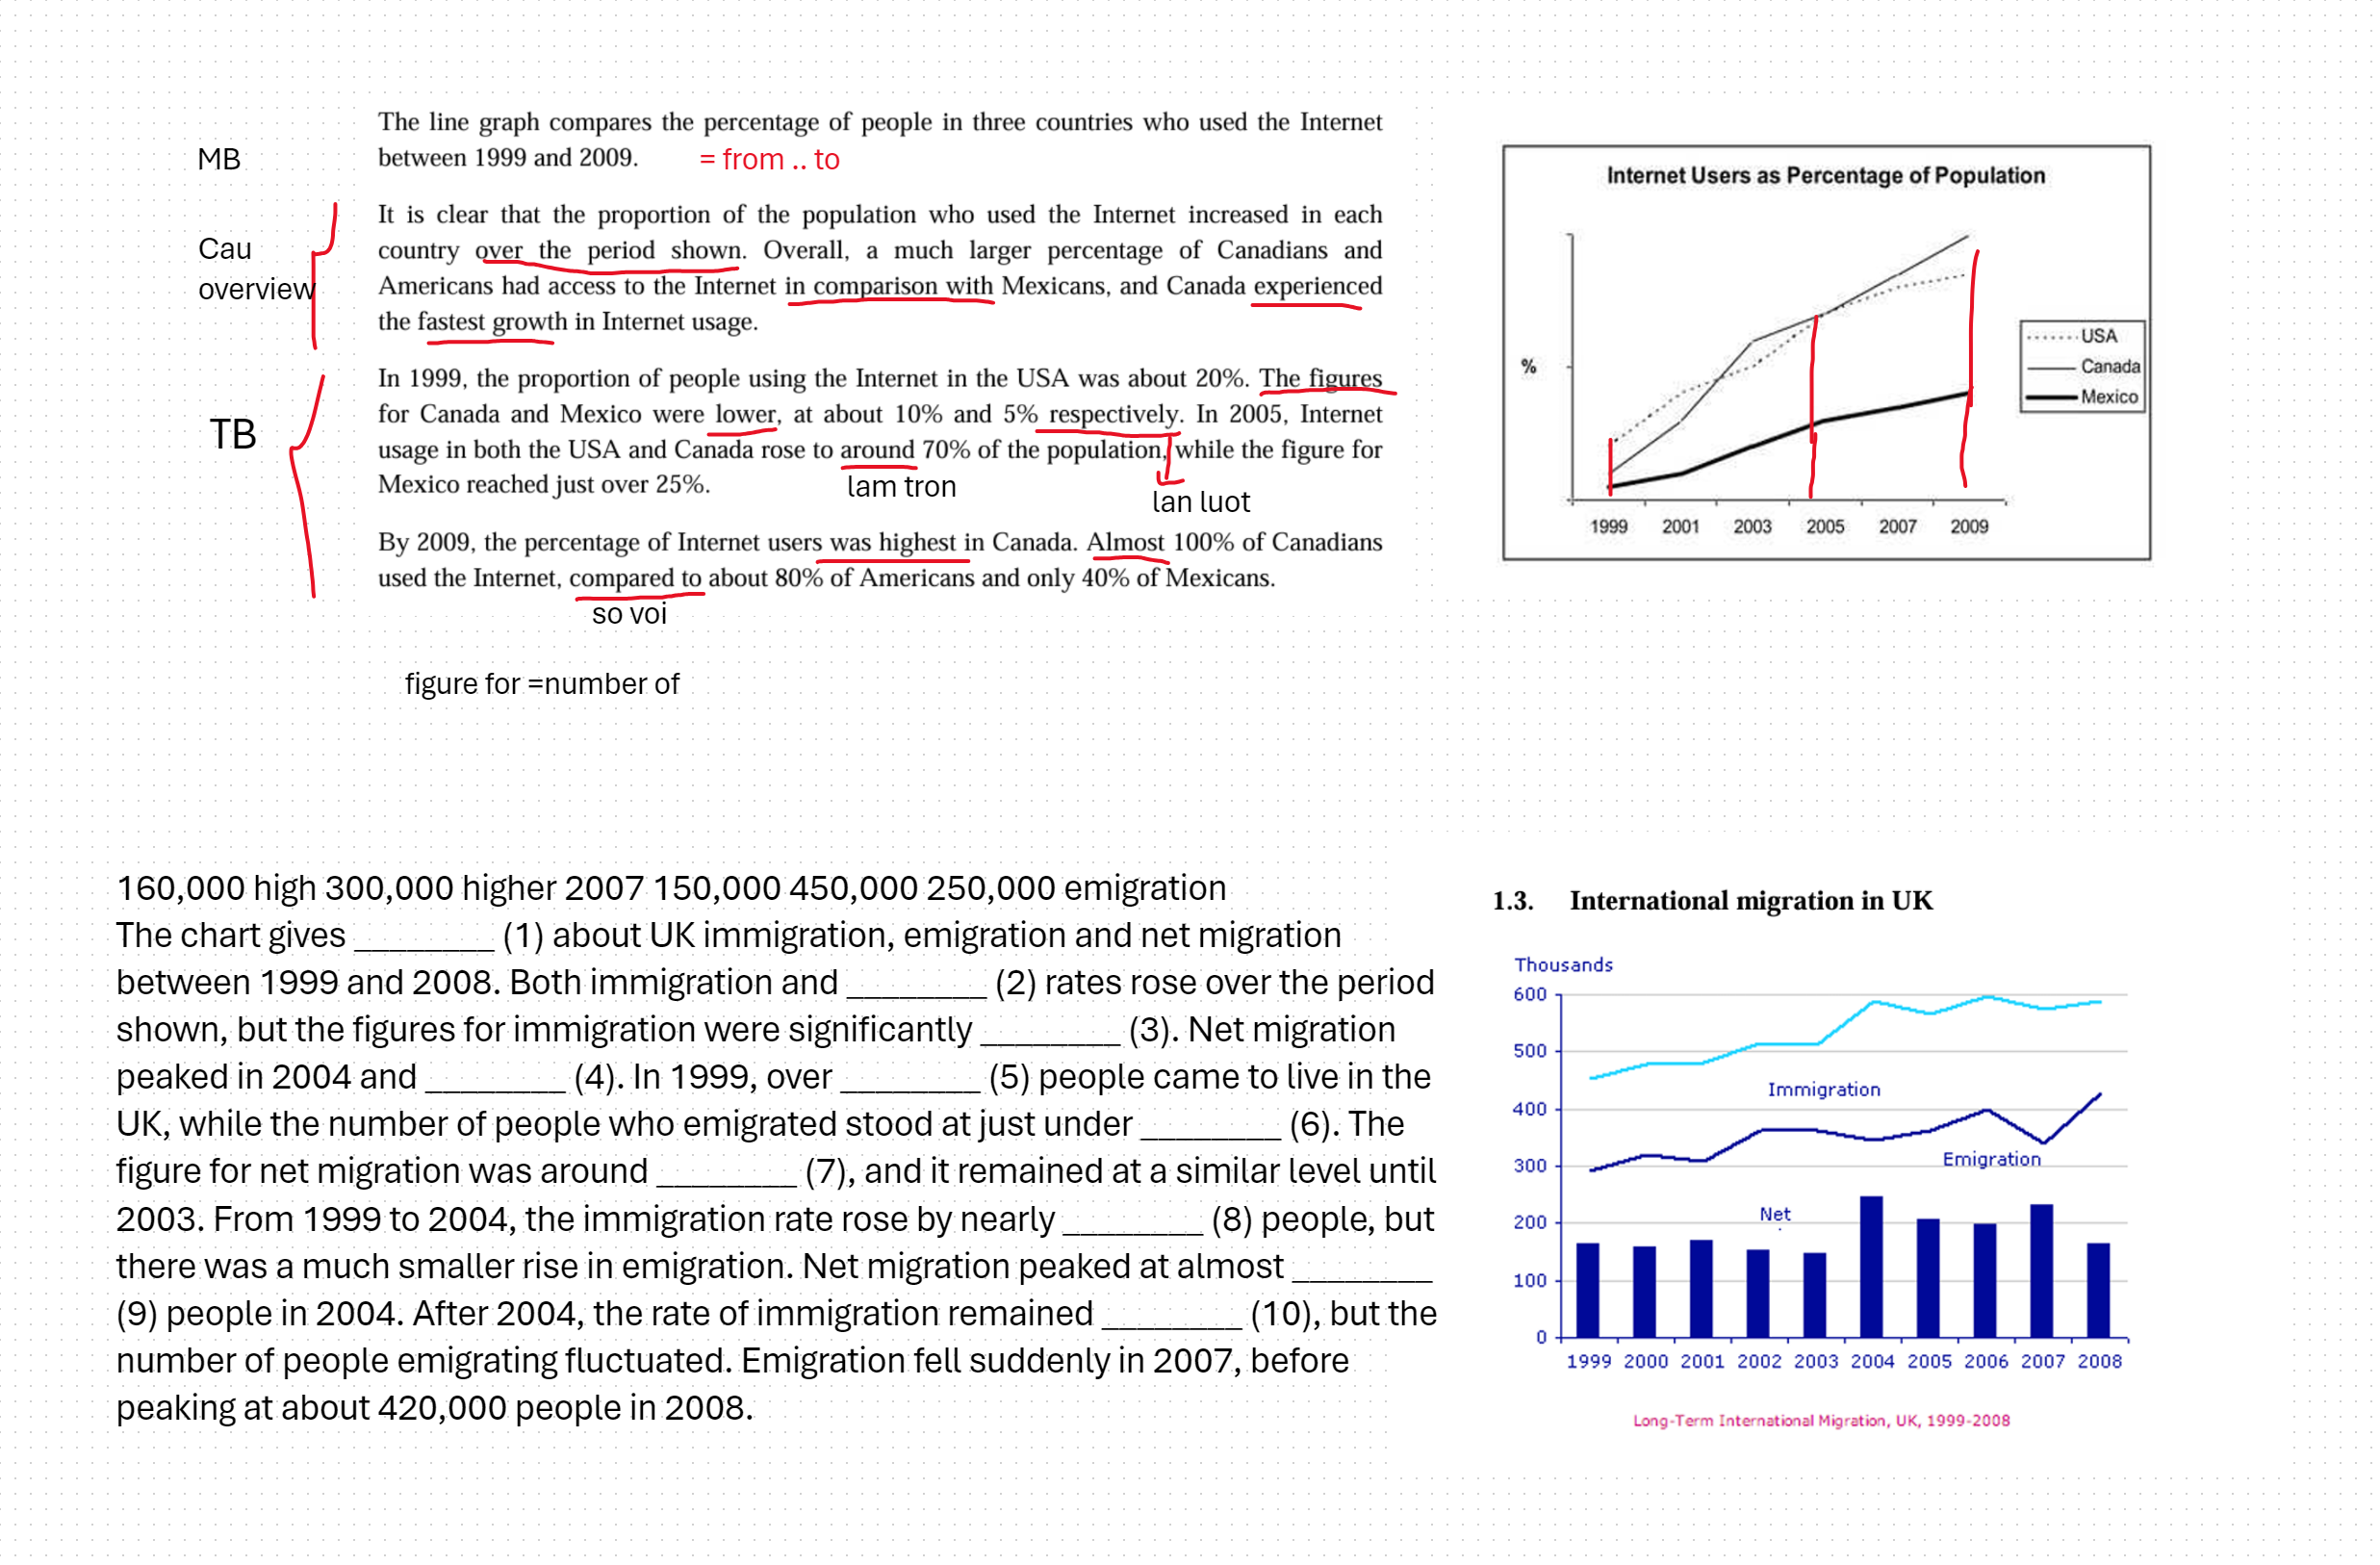
The line graph the compares ________ (1) of three countries people used Internet who in between the 1999 and 2009. It is the clear ________ (2) population of the Internet used who increased country in each over the period shown. Overall, a larger much ________ (3) and Americans of Canadians had Internet access comparison the in with Mexicans, experienced Canada fastest the ________ (4) in usage Internet. 1999, proportion In the of using people USA was the about Internet ________ (5). Figures the and Canada lower were Mexico for, about at ________ (6) and 10% respectively. 2005, In USA both the Internet usage and rose Canada population the around of ________ (7) 70% to. Figure the for over Mexico ________ (8) just reached. 2009, percentage By the of was Internet users highest ________ (9) in Canada. Almost Canadians of 100% Internet, used compared about to 80% Americans and ________ (10) Mexicans only.
Đáp án percentage proportion percentage growth 20% 5% rose 25% highest 40%
-----------------------------
160,000 high 300,000 higher 2007 150,000 450,000 250,000 emigration The chart gives ________ (1) about UK immigration, emigration and net migration between 1999 and 2008. Both immigration and ________ (2) rates rose over the period shown, but the figures for immigration were significantly ________ (3). Net migration peaked in 2004 and ________ (4). In 1999, over ________ (5) people came to live in the UK, while the number of people who emigrated stood at just under ________ (6). The figure for net migration was around ________ (7), and it remained at a similar level until 2003. From 1999 to 2004, the immigration rate rose by nearly ________ (8) people, but there was a much smaller rise in emigration. Net migration peaked at almost ________ (9) people in 2004. After 2004, the rate of immigration remained ________ (10), but the number of people emigrating fluctuated. Emigration fell suddenly in 2007, before peaking at about 420,000 people in 2008.
Đáp án
The chart gives information (1) about UK immigration, emigration, and net migration between 1999 and 2008. Both immigration and emigration (2) rates rose over the period shown, but the figures for immigration were significantly higher (3). Net migration peaked in 2004 and fell (4). In 1999, over 450,000 (5) people came to live in the UK, while the number of people who emigrated stood at just under 300,000 (6). The figure for net migration was around 160,000 (7), and it remained at a similar level until 2003. From 1999 to 2004, the immigration rate rose by nearly 150,000 (8) people, but there was a much smaller rise in emigration. Net migration peaked at almost 250,000 (9) people in 2004. After 2004, the rate of immigration remained high (10), but the number of people emigrating fluctuated. Emigration fell suddenly in 2007, before peaking at about 420,000 people in 2008.
